Datascience Capstone Project
As a part of Coursera IBM data science professional certificate course, I studied data science using Python. This course helped understand what is data-science, what a data-scientist do and what are various tools and techniques required one has to understand in order to analyze various datasets. At the end of course, I had to work on Capstone project to showcase skills I have learned.
Background
San Francisco has a large number of restaurants and food places. This study is trying to analyze various restaurant places, coffee shops and in general food places in San Francisco.
Audience
This report will try to answer various questions like what kind of restaurants San Francisco have or what kind of ratings they have. If someone who is new in San Francisco and would like to find nearby places by their cost and rating, then this report will help.
The report will also help someone who is looking to open a restaurant in the San Francisco area. By looking at various categories of restaurants and their ratings, one can make a decision if a new restaurant would be a good investment or not.
Data
In order to gather data for restaurants and their ranking, we have used Foursquare and Yelp.
Foursquare Data Source
Foursquare provides search and explore API. There are two types of offerings. Basic and Premium. We have used a Basic API which returns basic information about the restaurant, its category, address and few other characteristics.
I had to sign and get basic access. Foursquare providers CLIENT_ID and CLIENT_SECRET which needs to be passed for every API call. There are limits on the number of calls made per day.
Foursquare API https://developer.foursquare.com has all the details. We get the following information for each restaurant.
- Name
- Category
- Address
- Longitude
- Latitude
Yelp Data Source
Yelp is another data source used to query additional information which was not freely available on Foursquare. Yelp has a similar developer API available via direct REST interface or via SDK. We used SDK while developing this project. Yelp has various types of APIs. We used Yelp Fusion API for this exercise.
We query Yelp Business objects for each of the restaurants retrieved from Foursquare.
Yelp API https://www.yelp.com/fusion has all the details. We get following information for each restaurant
- Name
- Address
- Longitude
- Latitude
- Price
- Rating
- Review Count
Data Cleaning
Foursquare restaurants:
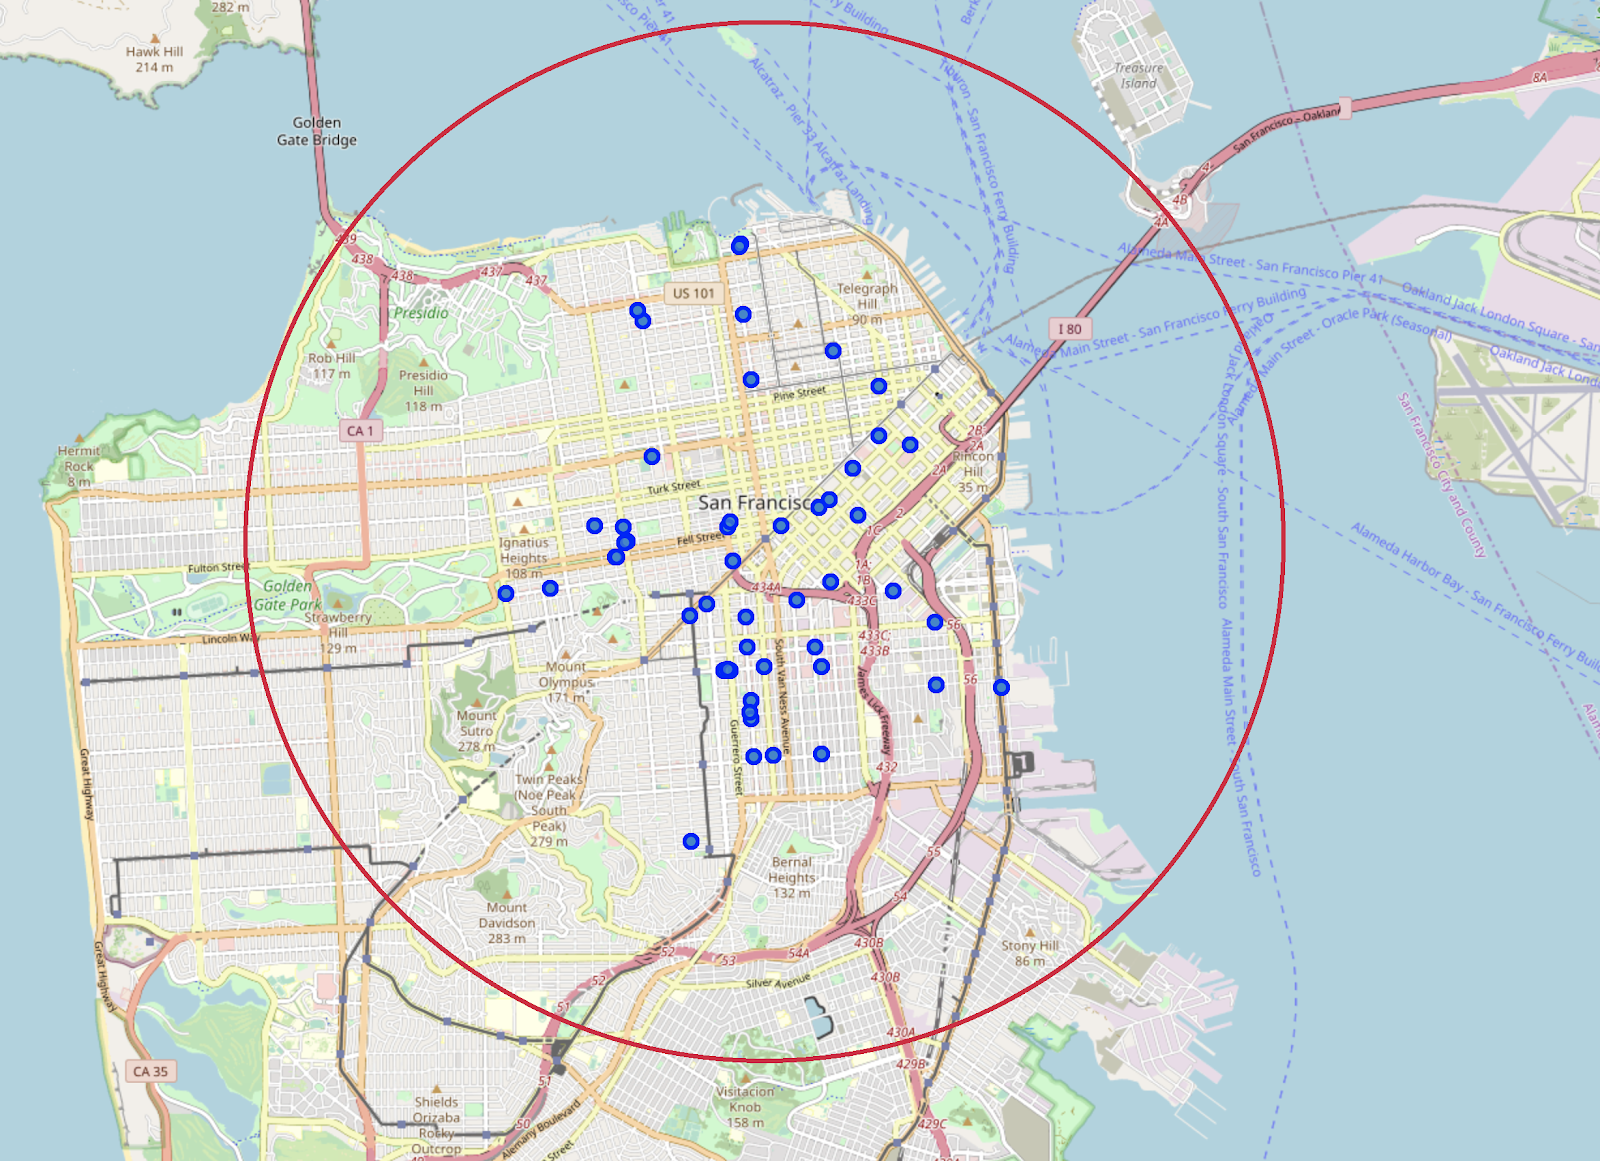
Yelp restaurants:
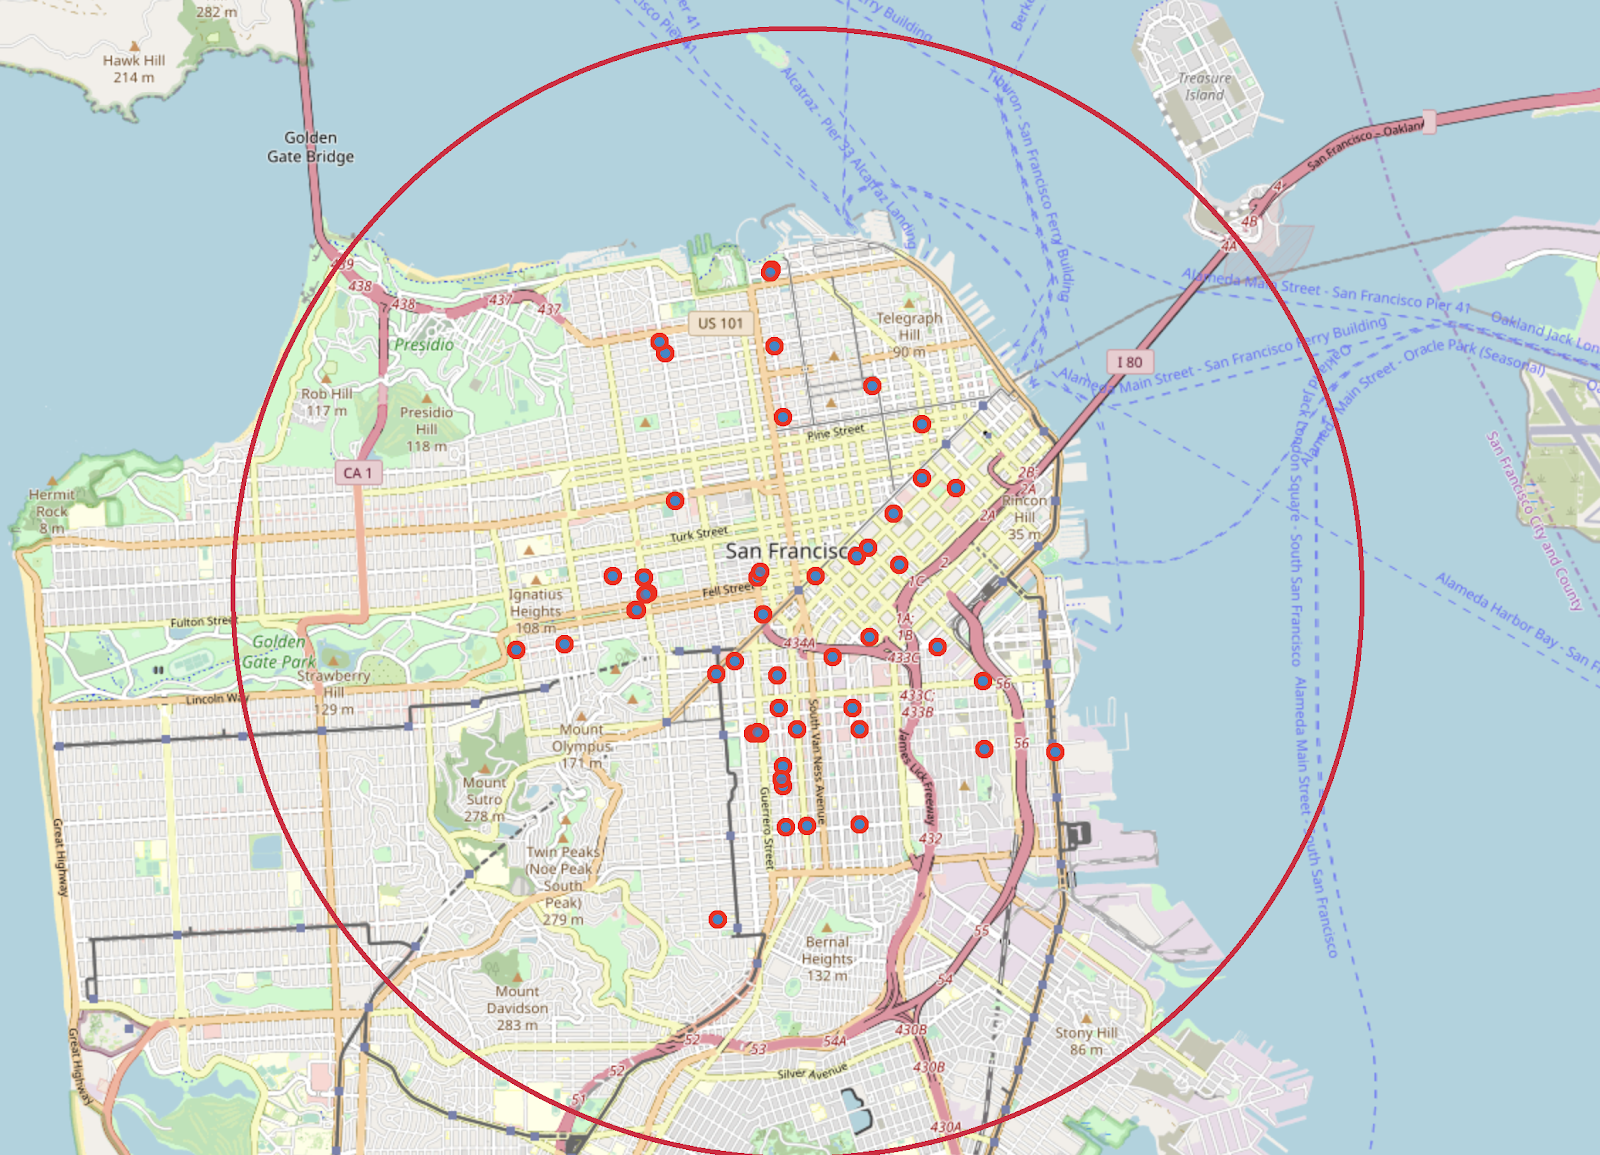
Quick overview of various categories of restaurants:
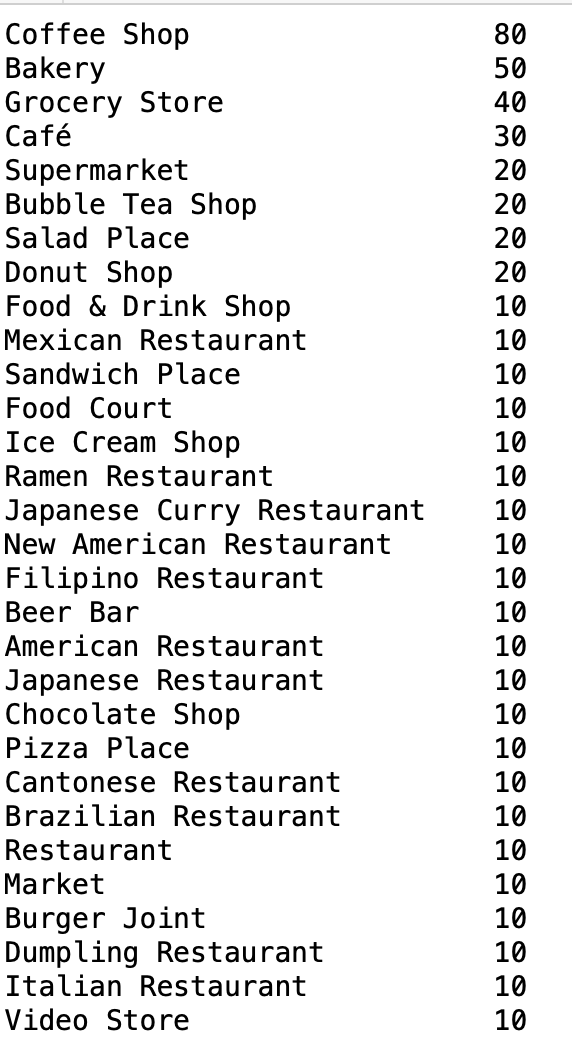
Following data cleaning was required
- Yelp has business/restaurants in its database but does not have enough information like Rating or Review Count. We dropped such business as they were very few.
- Yelp does not have business in its database. This was very rare. We found only 2-3 such occurrences and we dropped those restaurants from the dataset.
- We had to merge certain categories as they are actually very similar in nature or kind of food they serve. We merged.
- Market and Grocery Store into Supermarket
- Japanese Curry Restaurant into Japanese Restaurant
- New American Restaurant into American Restaurant
- Food & Drink Shop into Food Court
- Café into Coffee Shop
- Removed incorrect or erroneous categories like Video Store.
Methodology and Analysis
The objective of study is to give a comprehensive overview of location, rating, price range and other characteristics of the restaurants. Primary objective is to be able to tell if someone can open a restaurant in a specific neighborhood and what kind of restaurant that might be.
Categories
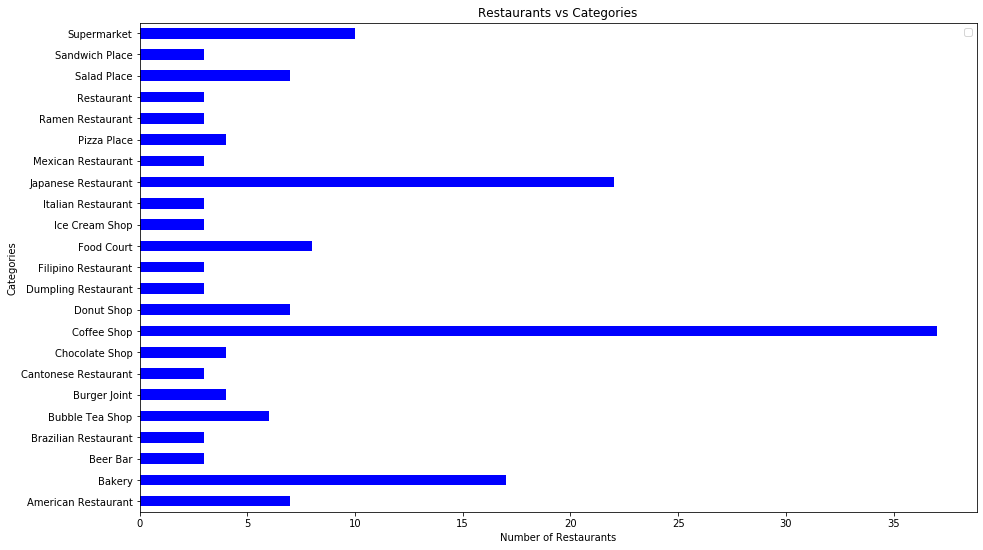
San Francisco has a large number of restaurants. The largest type of restaurants are Coffee Shop. For someone who visits San Francisco for the first time does not need to go far to find a Coffee Shop.
Surprisingly the second largest category is Japanese Restaurants. This was not expected.
Rating
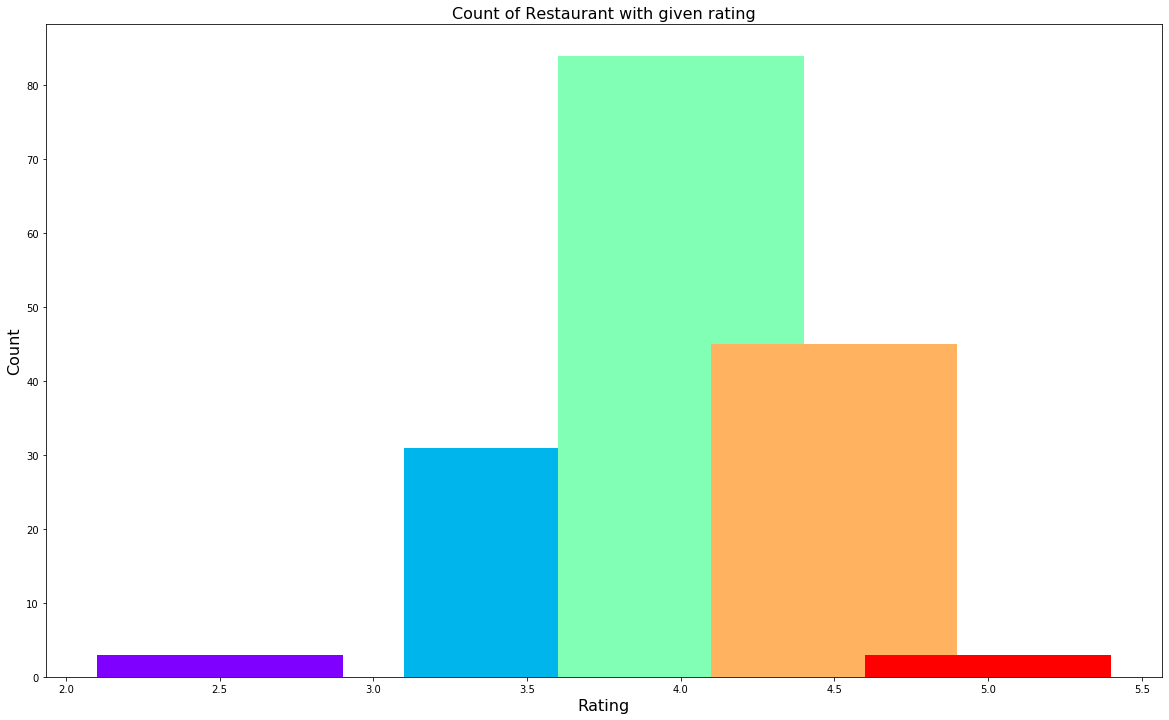
We have plotted ratings on x-axis and number of restaurants on y-axis. I am using bar chart with different color for each to indicate various ratings.
Lets look at ratings for these restaurants. Majority of the restaurants have good ratings like 4.0 and above. Those are shown in green color.
Clustering
Finally I have clustered various restaurants.
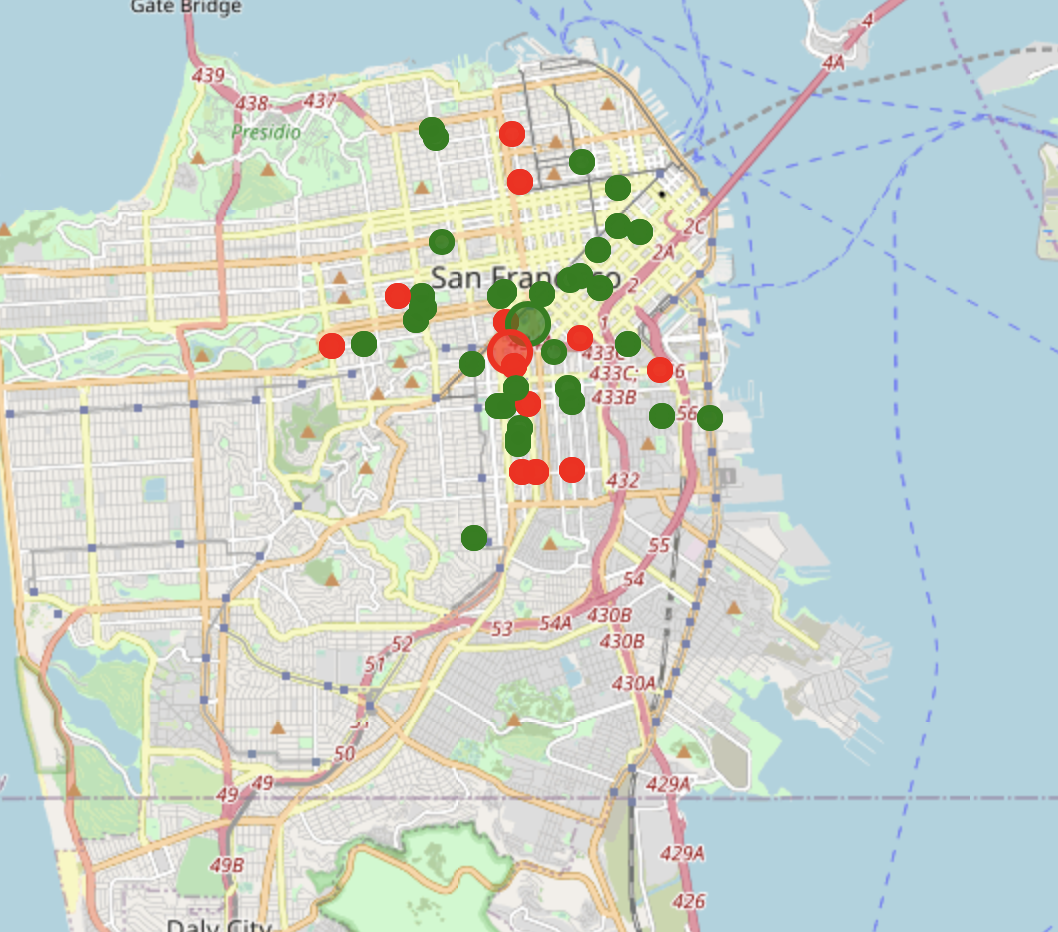
Above map shows both clusters mapped.
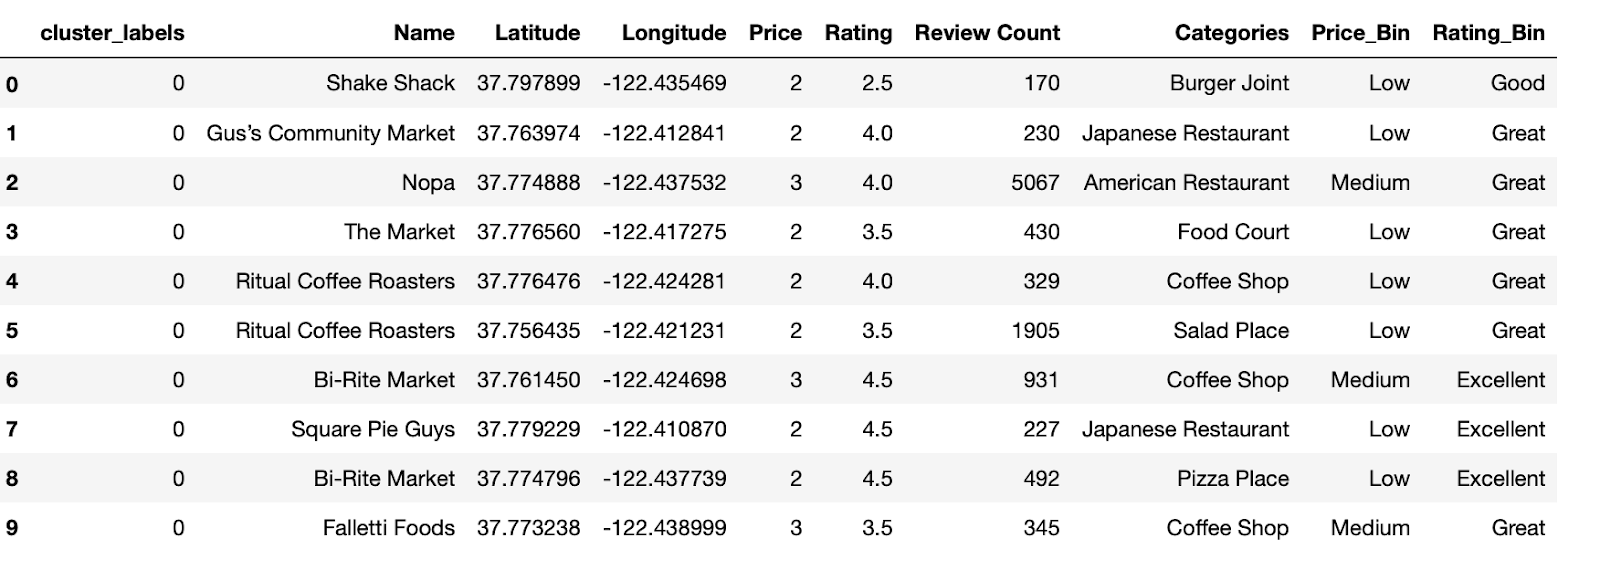
- The first cluster is shown in green dot. It has more elements and spread across the map.
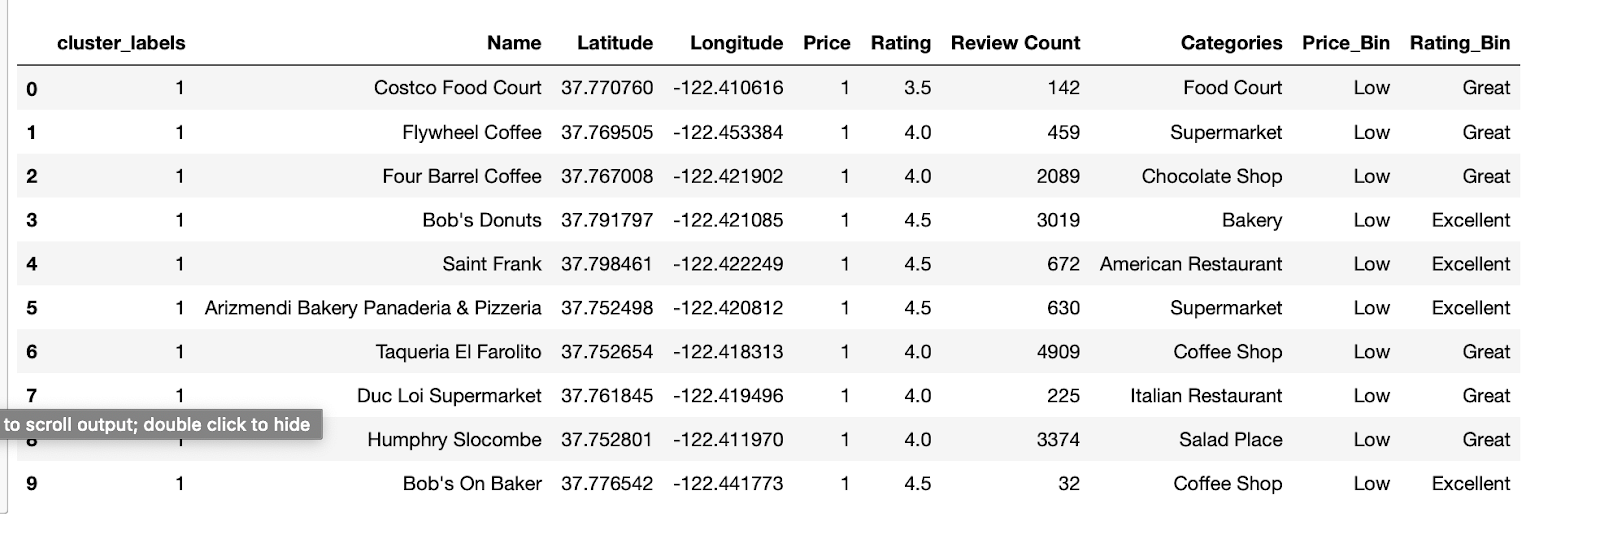
- Second cluster is shown in red dot. Its more concentrated in downtown area of San Francisco.
Observation and Discussion
This project is an attempt to give an overview of restaurants in SF area. Data was queried through Foursquare and Yelp to get rating, prices and other characteristics.
First we query all the restaurant data. Our dataset had around 4000 restaurants. Then we cleaned our dataset. We dropped places which didn’t have Yelp data or missing data.
There were some errors in data like incorrect categorization. We dropped such data from our dataset.
We also merged some common categories which had different categorization so that we compare accurate data.
Then we plotted categories on bar charts to see distribution of restaurants and categories.
One can see that the SF bay area has a wide variety of restaurants and food places. Given its cold weather and tech nature, Coffee Shops are most in the area. It was surprising to see so many Japanese Restaurants.
There is even a distribution of Excellent restaurants across the SF Bay area.
Conclusion
This project has tried to explore various restaurants, categories of San Francisco. Similar analysis can be done for each metropolitan area so that its easy to locate good quality restaurnts. This project has two publicly available data from sources like Foursquare and Yelp. But its possible to get more data sources like Facebook, Google etc